
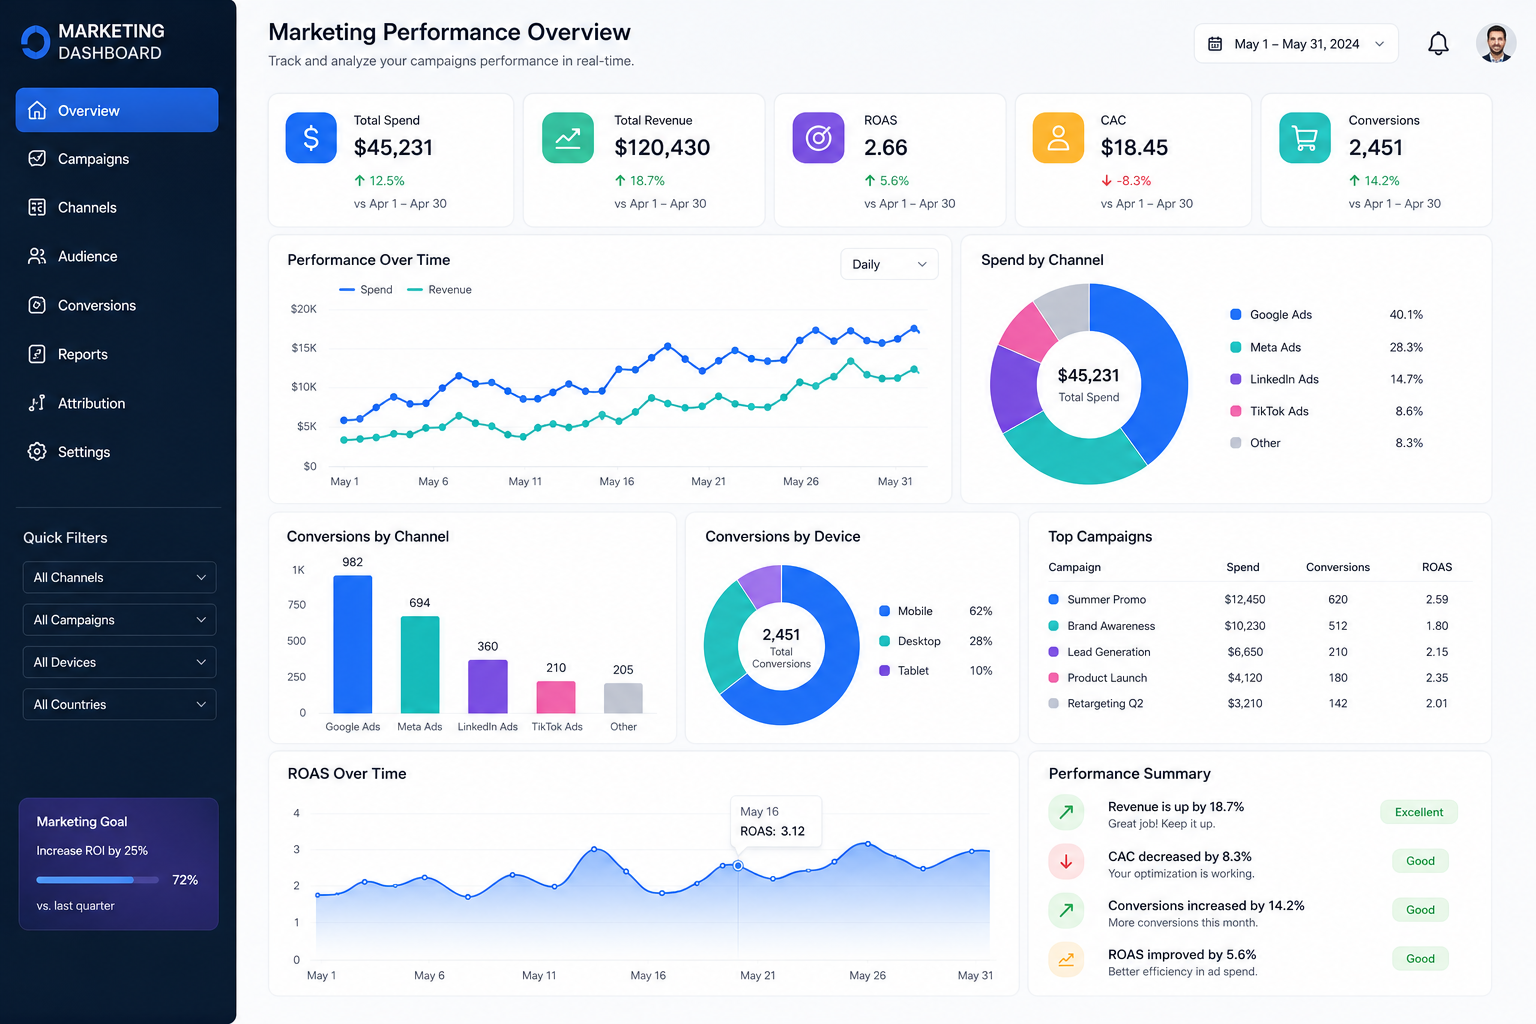
The true effectiveness of a Marketing Dashboard lies not in the immense amount of data it can display, but in the analytical discrimination and relevance of the selected metrics. Building an efficient and operational template requires setting aside so-called «vanity metrics» and focusing exclusively on Key Performance Indicators (KPIs) that reliably diagnose the economic and operational health of campaigns. In this detailed breakdown, we dissect the essential components for structuring high-impact templates.
1. Designing the Template by the Conversion Funnel
The most common mistake when downloading pre-designed templates is trying to adapt the company’s strategy to the template, when it should be exactly the opposite. For the visual panel to be truly actionable, the information must be segmented following the logic of the Customer Journey:
Module 1: Top of the Funnel (Acquisition and Reach)
This top section of the dashboard measures the brand’s ability to generate awareness and attract eyeballs. Metrics here do not speak to direct profitability, but to media-buying efficiency.
- Cost Per Mille (CPM): Essential for understanding if ad inventory is becoming more expensive.
- Click-Through Rate (CTR): The definitive indicator of creative message relevance. A low CTR indicates the ad is showing to the wrong audience or the message isn’t resonating.
- Organic vs. Paid Traffic: A stacked bar chart is ideal for visualizing the company’s reliance on paid media versus natural SEO positioning.
Module 2: Middle of the Funnel (Consideration and Capture)
Once the user lands on the website or landing page, the dashboard must measure the quality of that visit.
- Bounce Rate and Session Time: If CTR is high but time-on-page is 5 seconds, there is a total disconnect between the ad’s promise and the web experience.
- Marketing Qualified Leads (MQLs): Not all sign-ups are equal. The template must filter generic emails from profiles that truly fit the Buyer Persona.
- Cost Per Lead (CPL): Allows you to compare the thermal efficiency of different channels. For example, discovering that Meta Ads generates cheaper leads, but of lower quality than LinkedIn Ads.
Module 3: Bottom of the Funnel (Conversion and Profitability)
The hard core of financial performance. This is the section that Chief Financial Officers (CFOs) and executives will review obsessively.
- Customer Acquisition Cost (CAC): How much it costs—summing ad spend and operational costs—to acquire a final paying customer.
- Customer Life Time Value (LTV): A vital predictive metric. If CAC is greater than LTV, the business model is mathematically unsustainable long-term, regardless of sales volume.
- Return on Ad Spend (ROAS): Calculates the gross revenue generated by every monetary unit invested directly in ad platforms.
2. View Segmentation: Avoiding Analysis Paralysis
Flooding a team with a hundred KPIs on a single screen is counterproductive. The best data visualization practice is creating different tabs or «views» within the same template:
- Paid Media Operational View: Focused on active campaigns. Specialists need to see CPC, keyword quality scores, and daily budget consumption to make micro-optimizations.
- SEO / Content Strategic View: Geared towards organic results, keyword volumes in Google’s top 10, backlink acquisition, and corporate blog performance. Its analysis is more tendential, requiring Month-over-Month (MoM) comparison.
- Executive View (C-Level): An extremely clean visual summary. Completely omits granular metrics like CPC or email open rates, focusing solely on Total Spend, Attributed Revenue, LTV, and global CAC.
Strategic Reflection Point: When auditing the overall performance of your campaigns, which metric do you find most difficult to stabilize throughout the year? The steady increase in Customer Acquisition Cost (CAC) due to ad saturation, or maintaining Lead quality (MQLs) in high-volume campaigns? Join the comments to share metric stabilization strategies.