
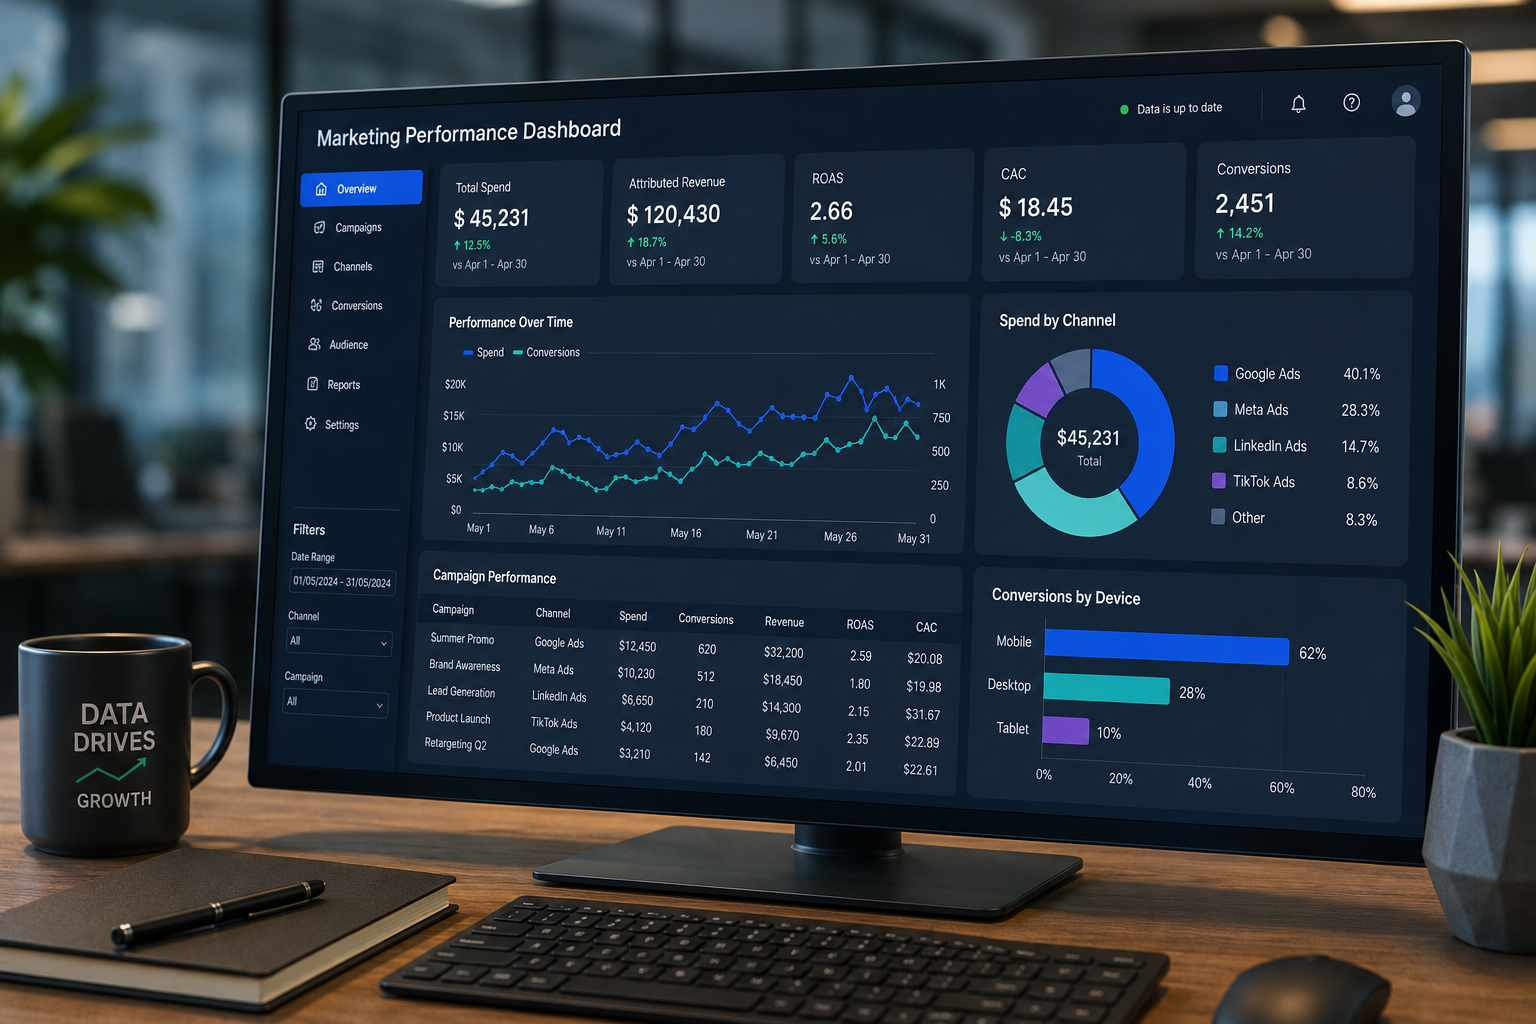
Data dispersion is one of the biggest bottlenecks for operational efficiency in the contemporary digital ecosystem. When marketing analysts and executive teams must independently extract metrics from advertising platforms, CRM systems, and financial databases, decision-making slows down drastically. A Marketing Performance Dashboard is not just a screen with charts; it acts as an organization’s single source of truth, consolidating all variables into an objective and auditable interface.
In this detailed guide, we explore the technical architecture required to structure a performance template from scratch that is functional, scalable, and resilient to third-party API changes.
1. The Architecture of a Centralized Dashboard: Beyond the Visuals
An effective performance panel is, essentially, a continuous diagnostic tool. The primary goal when creating a centralized template is to automate the ETL (Extract, Transform, Load) process. This means that whether the raw data comes from Meta Ads Manager, Google Analytics, or an internal financial ERP, the infrastructure must be capable of normalizing that information without constant manual intervention.
The Extract Phase
The first step in building your template is defining data sources. Manual spreadsheets are prone to human error. Best practice involves using API connectors or data automation tools (like OData connectors) that dump raw information into a central repository, such as a Cloud Data Warehouse, or directly into your analytics software’s query engine.
The Transform Phase with Power Query
This is where the real magic of data cleansing happens. Using transformation engines like Microsoft Power Query is crucial for standardizing formats. For instance, it’s common for one platform to report dates as «DD/MM/YYYY» and another as «MM/DD/YYYY». Power Query allows you to create automated rules that:
- Remove null or duplicate values in lead registries.
- Standardize campaign nomenclature (by extracting UTM tags).
- Merge Queries to cross-reference advertising spend from a platform with revenue logged in the CRM using a unique identifier.
The Load Phase and Data Modeling
Once cleaned, data should be organized into a «Star Schema». This involves having a «Fact» table (transactions, clicks, costs) surrounded by «Dimension» tables (dates, campaign names, geography). This model guarantees that the dashboard template loads information quickly without overloading system memory.
2. Visual Hierarchy: How to Read Performance
Once the data flow is automated, the template’s user interface (UI) design must follow strict User Experience (UX) principles. The template should read from top to bottom and left to right.
- Level 1 (Executive Level): The top of the template must contain exclusively macro KPIs. Total Spend, Attributed Revenue, Customer Acquisition Cost (CAC), and overall Return on Ad Spend (ROAS).
- Level 2 (Strategic Level): The center of the dashboard should feature temporal trend charts. A line graph comparing monthly spend versus user acquisition allows for the quick detection of seasonality or sudden performance drops.
- Level 3 (Tactical/Operational Level): The bottom section is reserved for detailed tables breaking down performance by individual campaign, ad group, or acquisition channel. This allows Paid Media specialists to identify exactly which segment is draining the budget.
3. Long-Term Maintenance and Scalability Tips
The most destructive error when designing dashboard templates is hardcoding variables. If the team decides to integrate a new channel (e.g., TikTok Ads) into the strategy, the template should assimilate that new data source dynamically, without an analyst needing to rewrite the cost-summation formulas.
To prevent this, it is recommended to use advanced DAX functions or pivot tables linked to expandable data ranges, ensuring the dashboard grows organically alongside the complexity of the marketing department.
Let’s Talk Tech Experience: When integrating various data sources into your performance panels, what has been the most frustrating hurdle you’ve faced? Cleaning inconsistent historical data across platforms, or achieving real-time updates that don’t break template formulas? Leave your perspective in the comments; technical debate enriches our community.