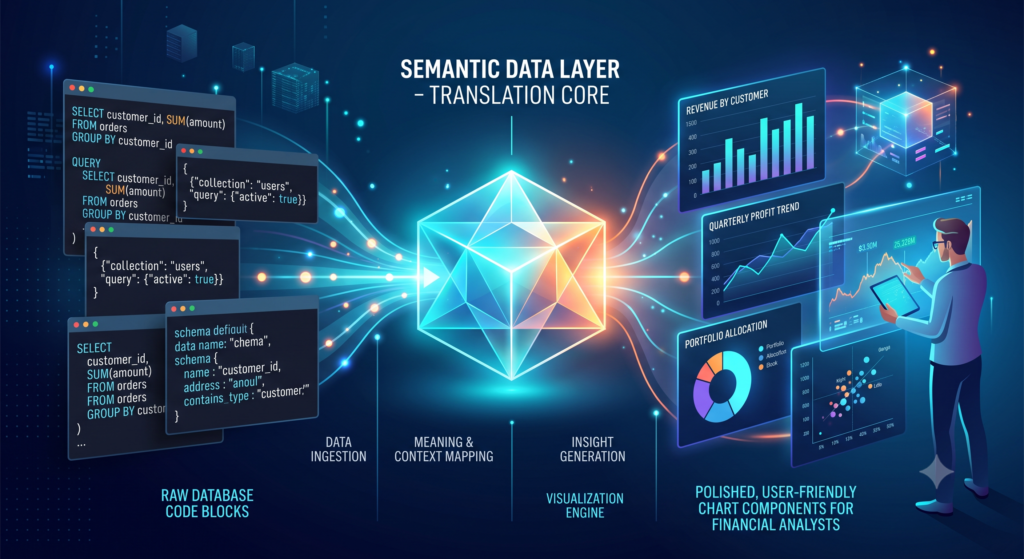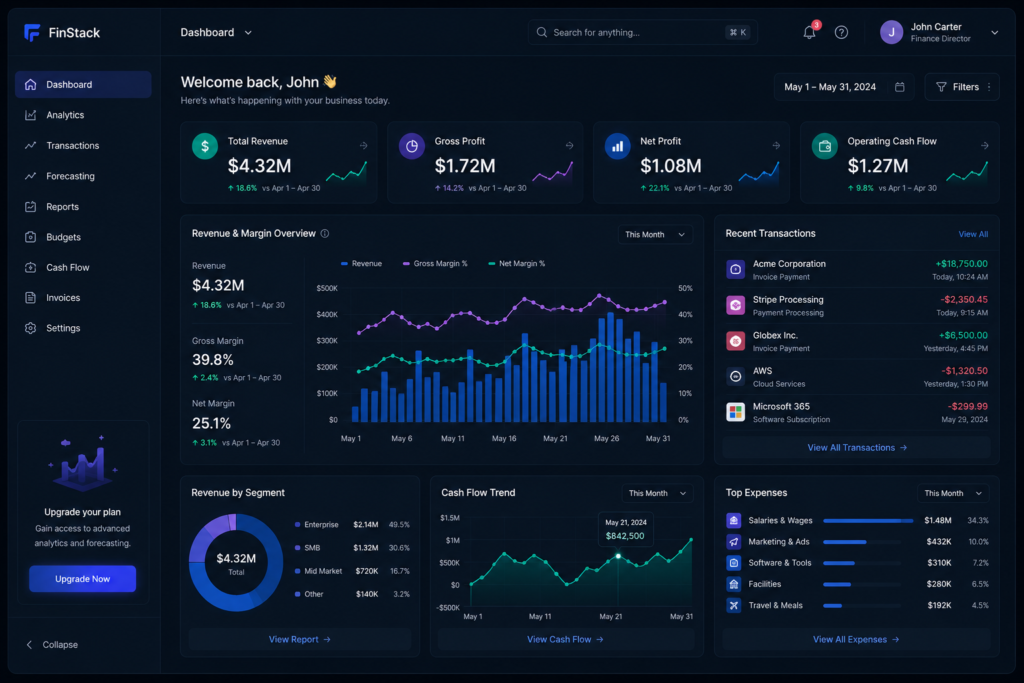

Budgeting and financial forecasting are fundamentally exercises in hypothesis testing. No matter how sophisticated a financial model is, actual operational results will inevitably deviate from projected targets. The true value of Financial Planning and Analysis (FP&A) lies in variance analysis—the systematic process of identifying, quantifying, and explaining these discrepancies.
Modern business intelligence has transformed variance analysis from static, end-of-month financial spreadsheets into interactive, diagnostic environments. This article explores the technical mechanisms, Price-Volume-Mix (PVM) decompositions, and interactive drill-through architectures that power modern variance reporting.
1. Moving Beyond Static Actual-vs-Budget Spreadsheets
Traditional variance reporting was delivered via static tables showing three basic columns: Budgeted Amount, Actual Amount, and Variance (expressed in dollars or percentages).
While this structure identifies that a discrepancy exists, it completely fails to explain why it occurred. For example, if a company’s sales revenue shows an unfavorable variance of $100,000, a static table cannot clarify whether the drop was caused by selling fewer product units, discounting unit prices, or experiencing an unfavorable shift in product mix.
Interactive variance analysis solves this by linking high-level financial line items directly to granular transactional records, allowing analysts to isolate root causes in real time.
2. Price-Volume-Mix (PVM) Decomposition Mechanics
To conduct a meaningful variance investigation on revenue or cost of goods sold (COGS), systems implement mathematical Price-Volume-Mix (PVM) decomposition. PVM breaks down the overall dollar variance into three distinct driver components:

Price Effect
Measures the financial impact of changes in the unit selling price, keeping volume and product mix constant:

Volume Effect
Measures the financial impact of selling a different total quantity of units, keeping baseline pricing and product mix constant:

Mix Effect
Measures the financial impact resulting from a shift in the proportion of high-margin versus low-margin products sold within the portfolio.
Interactive BI tools calculate PVM formulas automatically across thousands of SKUs, rendering the results as an intuitive Waterfall Chart that instantly reveals the primary driver of revenue performance.
[ Budgeted Revenue ] ---> (+ Price Effect) ---> (- Volume Effect) ---> (+ Mix Effect) ---> [ Actual Revenue ]
3. Interactive Drill-Through Architecture
The core technical capability of an interactive variance dashboard is the Drill-Through Pipeline. When an analyst notices an unfavorable variance in a high-level visual (such as Regional OPEX), the interface allows them to click directly on the visual element to navigate deeper into the data hierarchy.
+------------------------------------+
|  Level 1: Consolidated Variance    |  (e.g., Unfavorable $50k OPEX Variance)
+-----------------+------------------+
                  |
                  | [User Click / Filter Context Passed]
                  v
+------------------------------------+
|  Level 2: Departmental Breakdown   |  (e.g., Unfavorable $45k Marketing Variance)
+-----------------+------------------+
                  |
                  | [User Click / Filter Context Passed]
                  v
+------------------------------------+
|  Level 3: General Ledger Account   |  (e.g., Software Licensing Cost Center)
+-----------------+------------------+
                  |
                  | [SQL Query to Transaction Table]
                  v
+------------------------------------+
|  Level 4: Raw ERP Vendor Invoice   |  (e.g., Specific Vendor Invoice #8902)
+------------------------------------+
Achieving this low-latency drill-through requires maintaining relational integrity across the data warehouse, utilizing star-schema data models where fact tables (transactions) are seamlessly linked to dimensional hierarchies (chart of accounts, organizational departments, date calendars).
💬 Interactive Perspective: Your Experience
When analyzing budget deviations or managing promotional campaign expenses, identifying the exact root cause of an unexpected cost is vital. How does your team handle variance investigations? Do you utilize interactive dashboards with drill-through capabilities, or do you still find yourself digging manually through individual spreadsheet tabs to locate discrepancies?
4. Frequently Asked Questions (FAQ)
What is the difference between a favorable and unfavorable variance?
A variance is classified based on its impact on net profit. For revenue, actual results above budget yield a favorable variance, while actuals below budget yield an unfavorable variance. For expenses, actual costs below budget represent a favorable variance, whereas costs exceeding budget yield an unfavorable variance.
How does interactive variance analysis support rolling forecasts?
Interactive variance analysis feeds directly into rolling forecasts by validating or disproving model assumptions in real time. When a variance is identified as structural (e.g., a permanent price increase from a core supplier) rather than temporary, the new baseline cost is automatically pushed into the rolling forecast model for future quarters.