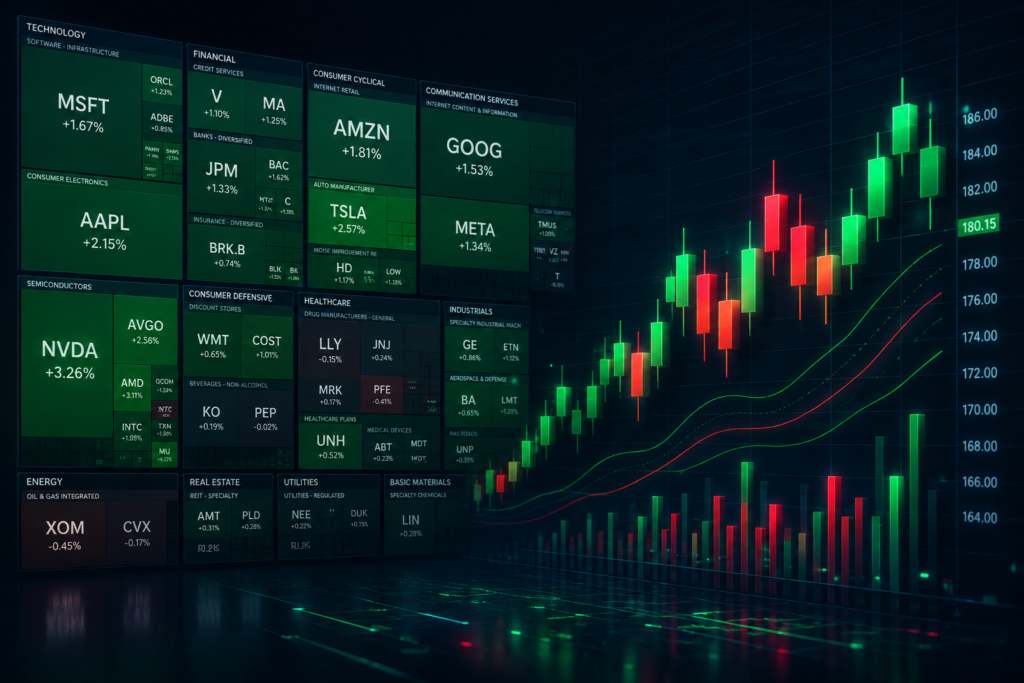
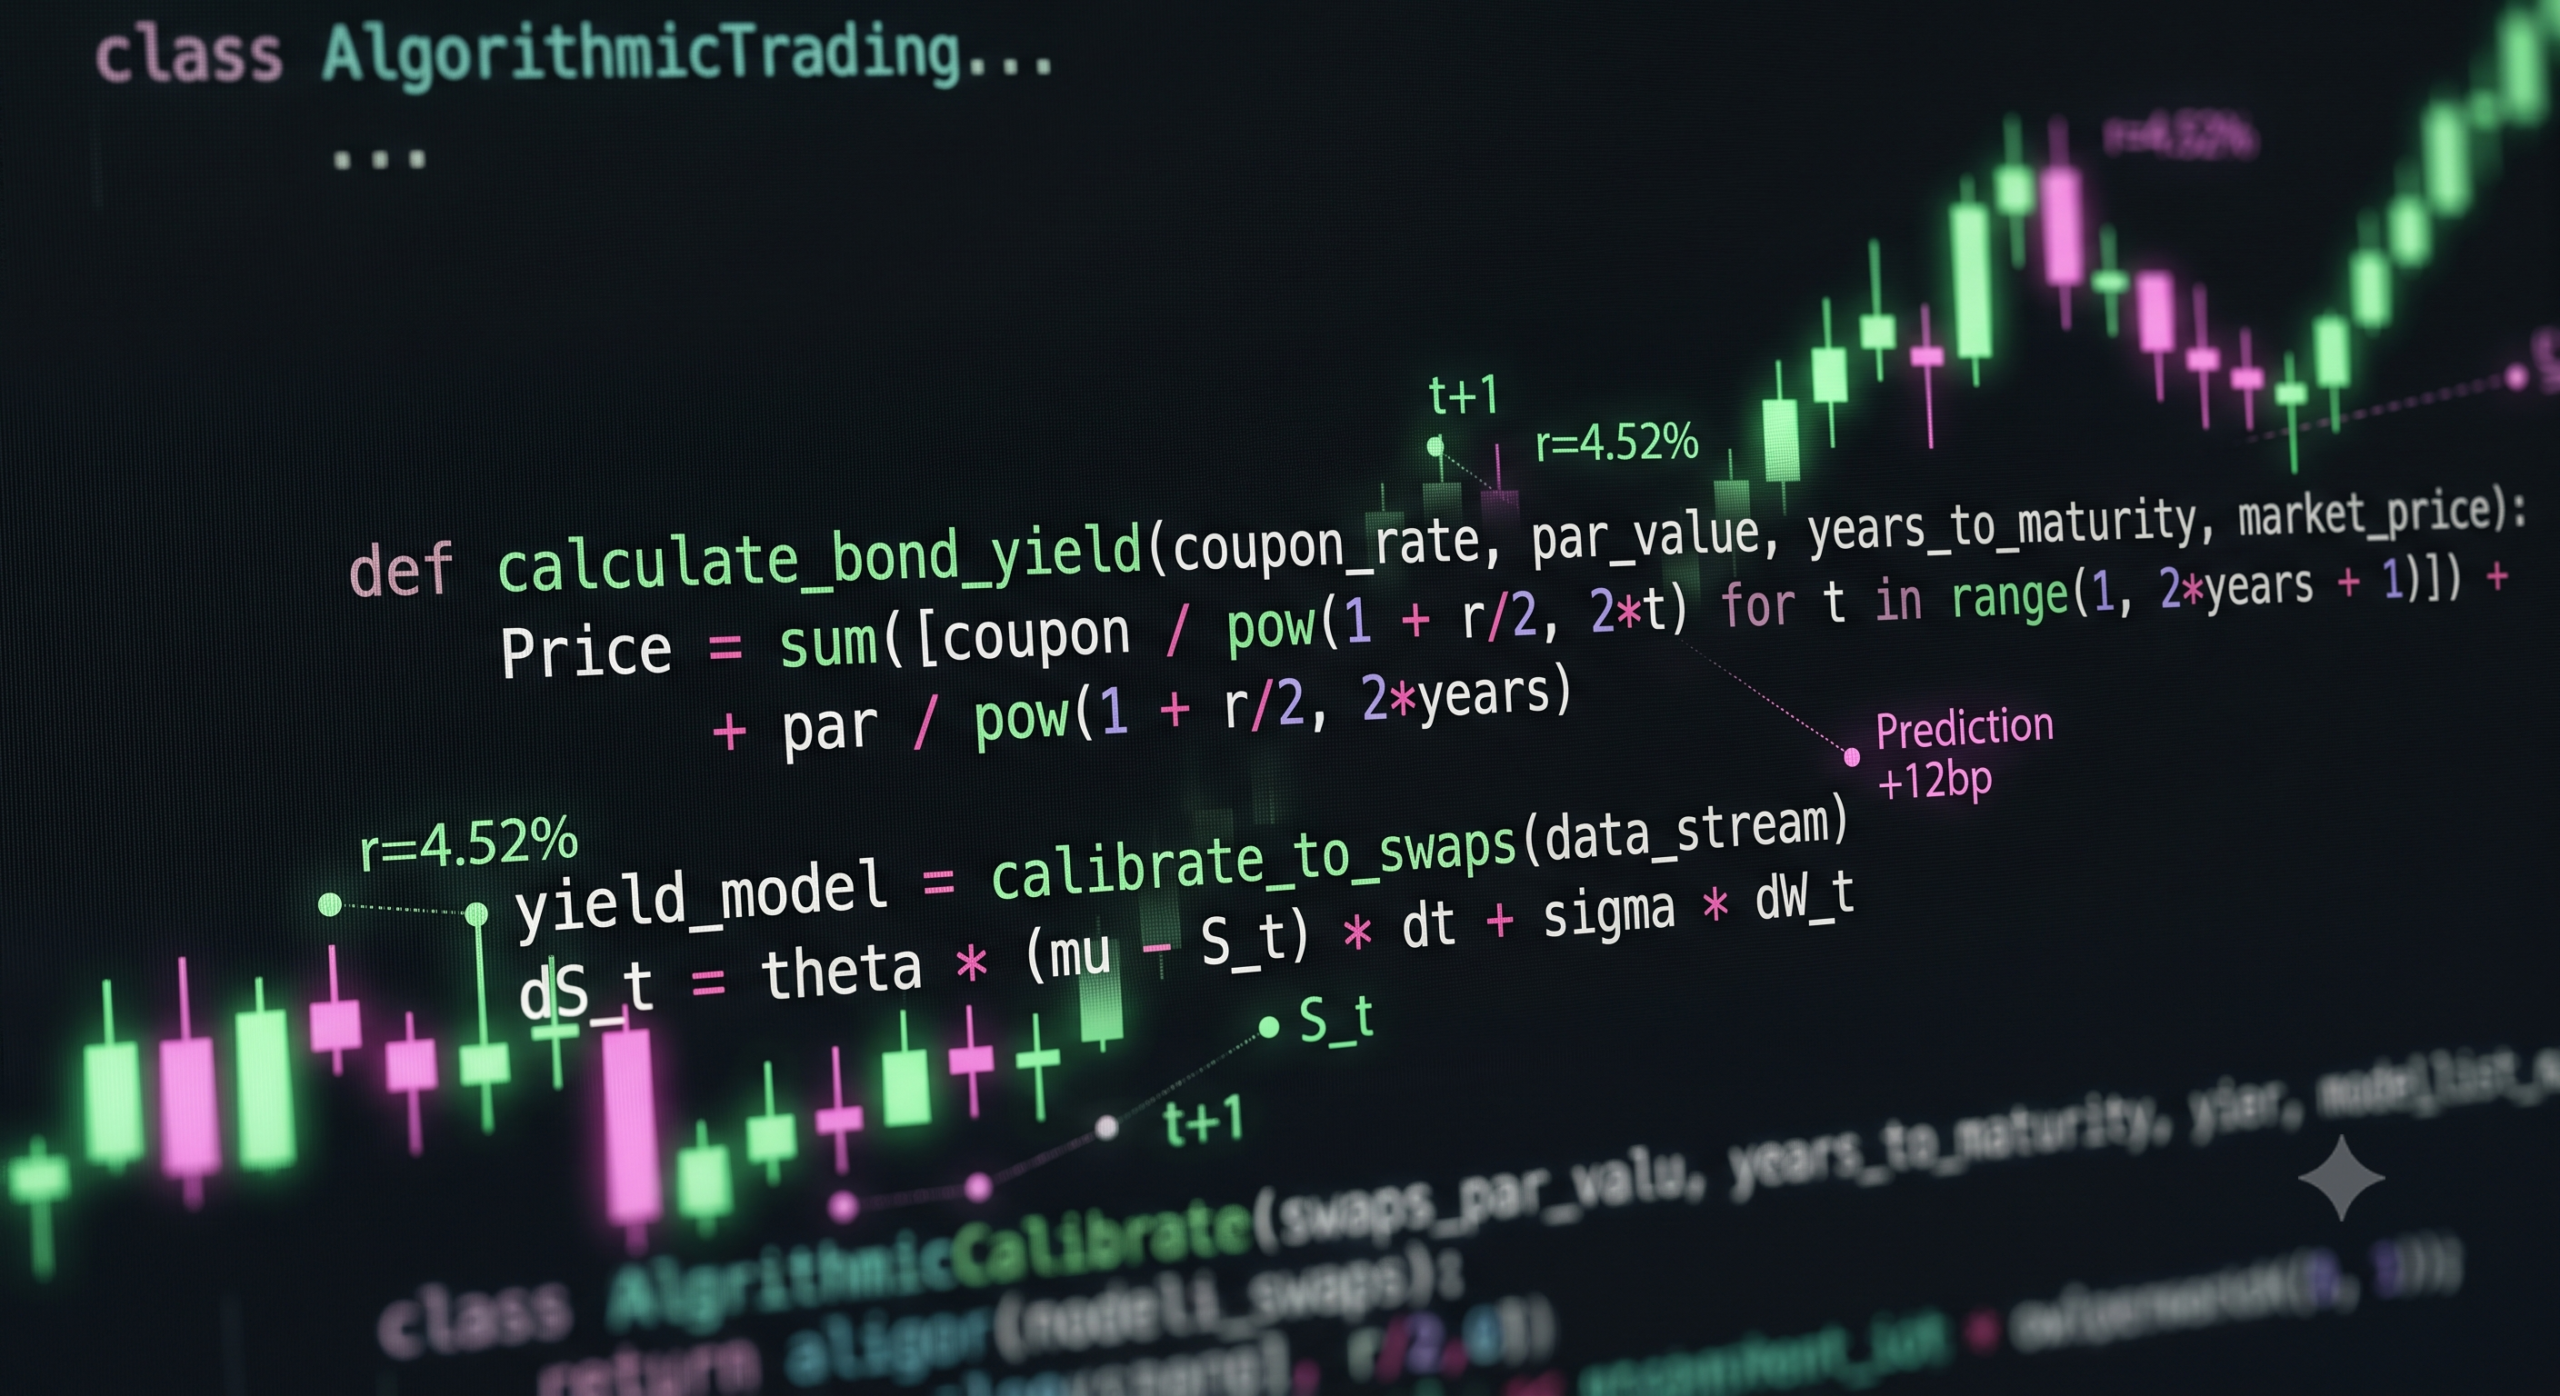
In the highly competitive domain of quantitative finance, extracting informative signals from heterogeneous data sources—such as market prices, order flow, and unstructured textual data—is the foundation of profitability. Algorithmic yield analysis is the practice of utilizing mathematical models and computational techniques to process vast amounts of financial data, identify hidden patterns, and optimize capital allocation under strict uncertainty.
As we move deeper into 2026, the intersection of advanced machine learning and traditional financial modeling has transformed how institutions evaluate alphas, execute trades, and manage portfolio turnover.
1. The Core Components of Financial Algorithms
Algorithmic models must not only forecast future outcomes but also support high-stakes decisions that directly impact risk and capital distribution. To build a robust algorithmic yield system, quantitative analysts rely on three foundational pillars:
- Mathematical Models: The core of the algorithm, utilizing statistical methods, optimization techniques, and machine learning architectures to process raw data.
- Execution Logic: The programmed ruleset that dictates exactly how the system acts on the mathematical analysis, whether executing a high-frequency trade or rebalancing a long-term portfolio.
- Risk Management Mechanisms: Hard-coded constraints designed to prevent catastrophic drawdowns and ensure regulatory compliance.
2. Standard Metrics for Algorithmic Evaluation
To objectively compare the performance of different trading alphas or yield strategies, analysts utilize a strict set of standardized mathematical metrics.
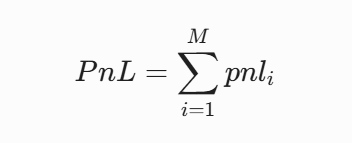
The Total Profit and Loss (PnL) calculates the aggregate economic performance of the portfolio across all assets:
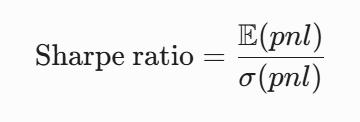
However, absolute return is meaningless without factoring in risk. The Sharpe Ratio is utilized to measure the risk-adjusted return, dividing the expected profit by its standard deviation:
Furthermore, risk managers track the Maximum Drawdown (MDD) to understand the worst-case historical scenario:
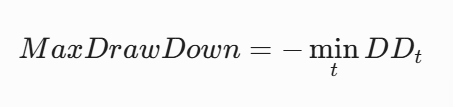
Where $DD_t$ represents the decline from the historical peak. Finally, Turnover measures the absolute change in portfolio positions between rebalancing dates, which is critical for estimating transaction costs and friction.
3. AI Copilots in Financial Modeling Workflows
Despite the rapid advancement of algorithmic trading, the day-to-day workflow of many analysts building fully integrated three-statement financial models has historically remained tied to Excel. In 2026, a race is occurring between foundational LLMs (like Claude and Microsoft Copilot) and specialized financial AI tools (like Shortcut).
While AI tools are excellent for kickstarting models from scratch (getting them from 0 to 60% completion) and accelerating formatting, they still struggle with complex flowthrough assumptions, balance sheet integration, and circularity errors. Relying on AI to finalize a financial model without extensive human review introduces severe hidden risks, as these tools often obscure errors in places human auditors typically do not look.
💬 Analyst’s Point of View
When backtesting a new yield algorithm, what metric do you weigh most heavily during periods of high volatility? Do you prioritize a high Sharpe Ratio, or are you more focused on minimizing the Maximum Drawdown to preserve capital?
Frequently Asked Questions (FAQ)
Can financial algorithms eliminate market risk entirely?
No. Financial algorithms process historical data and statistical probabilities to optimize decision-making. They cannot predict unprecedented market events (black swans) and carry inherent risks related to overfitting, execution latency, and systemic market shocks.
What is the biggest risk when building algorithmic models?
Relying solely on historical data for future predictions is a critical failure point. Algorithms must be regularly tested, updated, and fed with high-quality, diverse data sources. Overcomplicating the algorithm unnecessarily can also lead to curve-fitting, where the model performs perfectly in simulations but fails in live markets.