
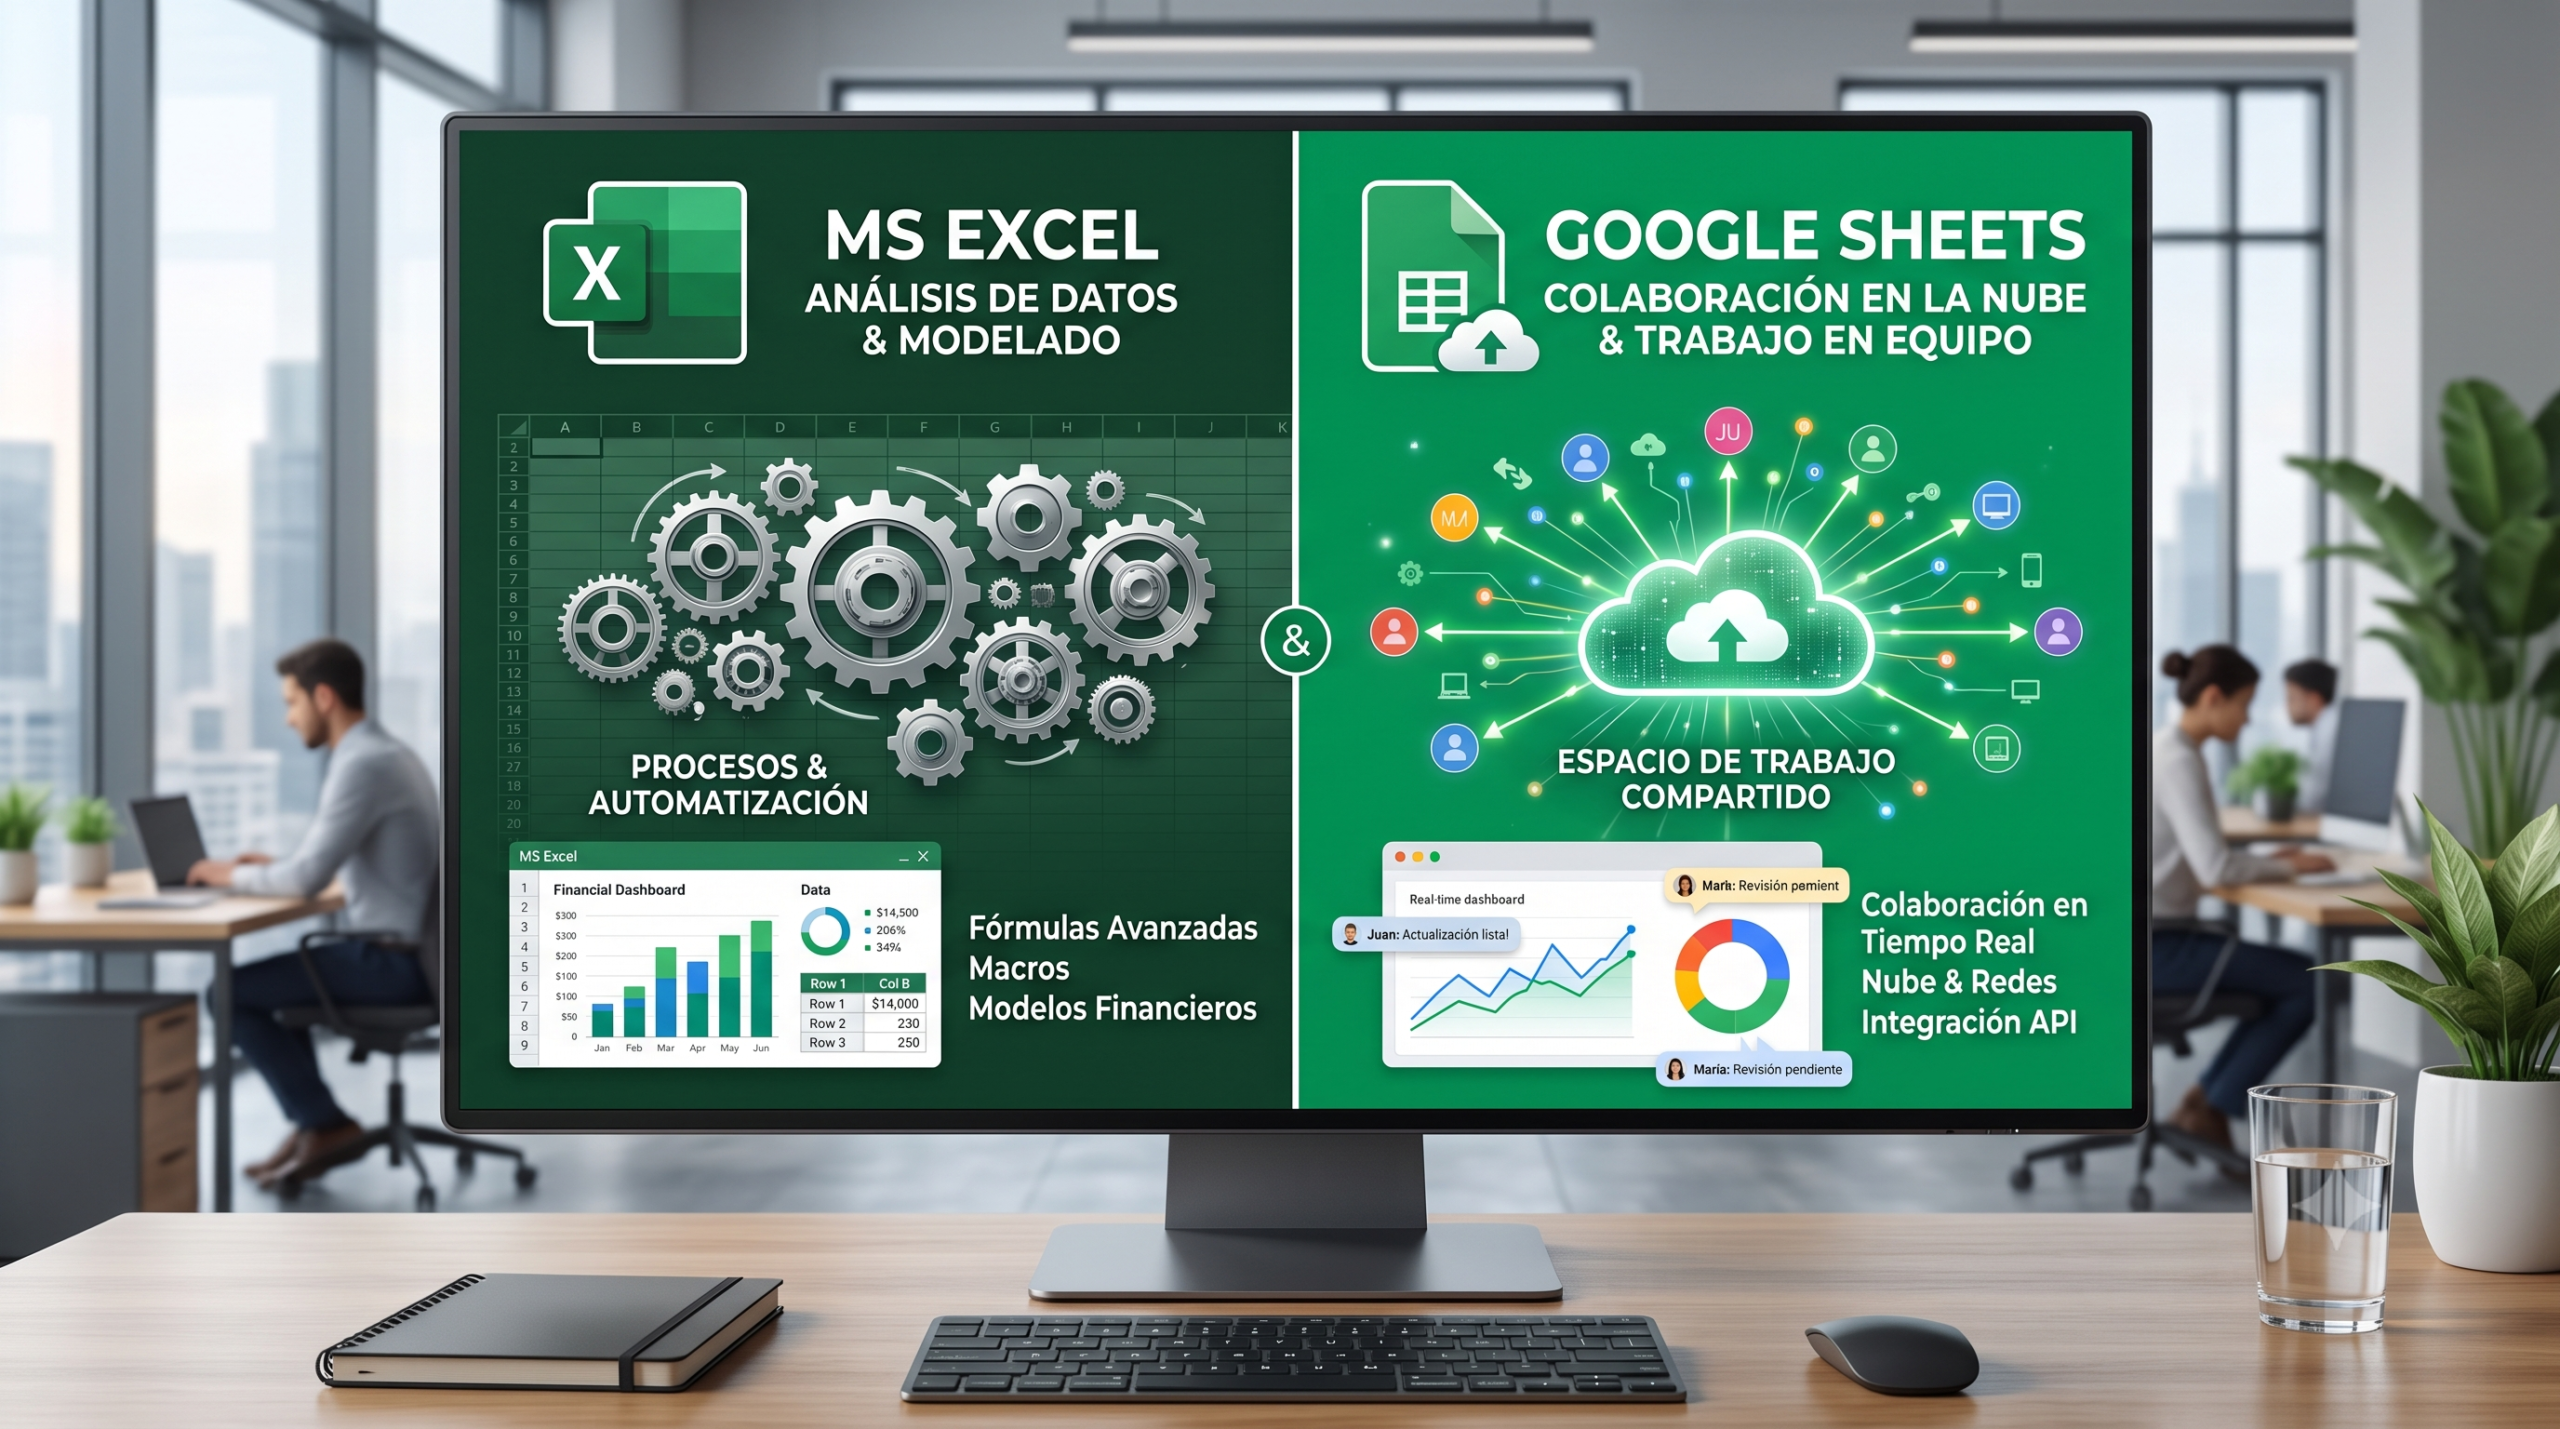
The corporate financial ecosystem demands precise, auditable tools capable of handling large volumes of data without compromising the integrity of projections. The debate over whether to use Microsoft Excel or Google Sheets for financial modeling has transcended personal preferences to become a critical decision regarding data architecture and operations (Data Ops).
This technical guide objectively breaks down the processing capabilities, automation ecosystems, and structural viability of both platforms in the context of modern financial modeling, moving away from subjective opinions to focus on computational limits and operational efficiency.
1. Computational Architecture and Processing Limits
The first factor to evaluate when building Free Cash Flow (DCF) projection models, Mergers and Acquisitions (M&A) scenarios, or sensitivity analyses, is the platform’s raw capacity to process data without latency.
The Microsoft Excel Engine
Historically, Excel has been the immovable standard in investment banking and venture capital. Its desktop architecture (now complemented by cloud versions) allows it to utilize the machine’s local RAM and multi-core processing. Excel supports up to 1,048,576 rows per sheet, but its true technical advantage lies in the integration with Power Pivot and the xVelocity engine, which compresses and processes tens of millions of records without crashing the visible file.
The Google Sheets Structure
Google Sheets is a purely cloud-native platform. Its current limit stands at 10 million cells per workbook. While this is sufficient for startup operational budgets and recurring expense (OPEX) models, it can become a bottleneck for data analysts attempting to cross-reference large databases of historical transactions. However, its architectural advantage is seamless integration with Google BigQuery, allowing Sheets to act as a simple visualization layer while heavy processing occurs on Google’s servers.
2. Collaborative Modeling vs. Version Control
The nature of financial work has evolved towards simultaneous collaboration. This is where the approaches of both tools diverge.
- Google Sheets: It was designed from the ground up for concurrent collaboration. Multiple analysts and CFOs can edit macroeconomic assumptions in real-time without creating file conflicts. Its version history is granular, allowing audits of which user modified a specific cell at an exact minute, which is fundamental for transparency and data governance.
- Microsoft Excel: Although cloud co-authoring via OneDrive or SharePoint has improved drastically, complex financial model files (especially those with heavy macros or links to external databases) often become unstable with multiple users editing simultaneously. Standard practice in Excel remains the use of structured repositories to maintain strict version control (v1.0, v2.1_Final, etc.).
3. Automation, Formulas, and Development Environment
A robust financial model must be dynamic. Syntax and the automation environment are decisive factors for efficiency.
Dynamic Arrays and Formulas
Both platforms have adopted Dynamic Arrays, revolutionizing modeling by eliminating the need to copy and paste formulas across columns. Functions like FILTER, UNIQUE, and SORT are present in both ecosystems. However, Google Sheets has had a years-long head start with its QUERY function, which allows writing SQL-like statements directly in a cell to manipulate data—an invaluable tool for consolidating scattered databases into a financial model.
VBA vs. Google Apps Script vs. Python
- Excel: The Visual Basic for Applications (VBA) ecosystem is a legacy language that supports the majority of global financial models. It is powerful for local automation but is not web-compatible. The recent native integration of Python in Excel allows running advanced statistical analysis scripts and libraries like Pandas or NumPy directly on the grid, elevating predictive analytics to another level.
- Google Sheets: Utilizes Google Apps Script, based on JavaScript. It is exceptionally superior for cloud-based automations, such as connecting the spreadsheet to third-party APIs, sending automated emails upon reaching a debt covenant threshold, or synchronizing data in real-time with a CRM system.
Debate for the Financial Community: When structuring complex budgets or valuation models, which factor has been more decisive for your team: the local processing power and keyboard shortcuts of Excel, or the fluid collaboration and auditing capabilities of Google Sheets? Join the discussion in the comments.
4. Frequently Asked Questions (FAQ) on Modeling Tools
Can I import a complex financial model from Excel to Google Sheets without losing functionality? It depends on the model’s architecture. If the model relies strictly on standard formulas and arrays, migration is usually seamless. However, if the Excel file contains macros programmed in VBA, COM add-ins, or data connections via Power Query, these functionalities will be lost or require rewriting in Google Apps Script.
Which platform is more secure for confidential financial data? Both platforms comply with enterprise security standards (SOC 2, ISO 27001). In Excel, security often relies on local file management and corporate network policies. In Google Sheets, user-level access control and edit permissions by cell ranges provide very strict data governance, provided that workspace sharing policies are correctly configured.