
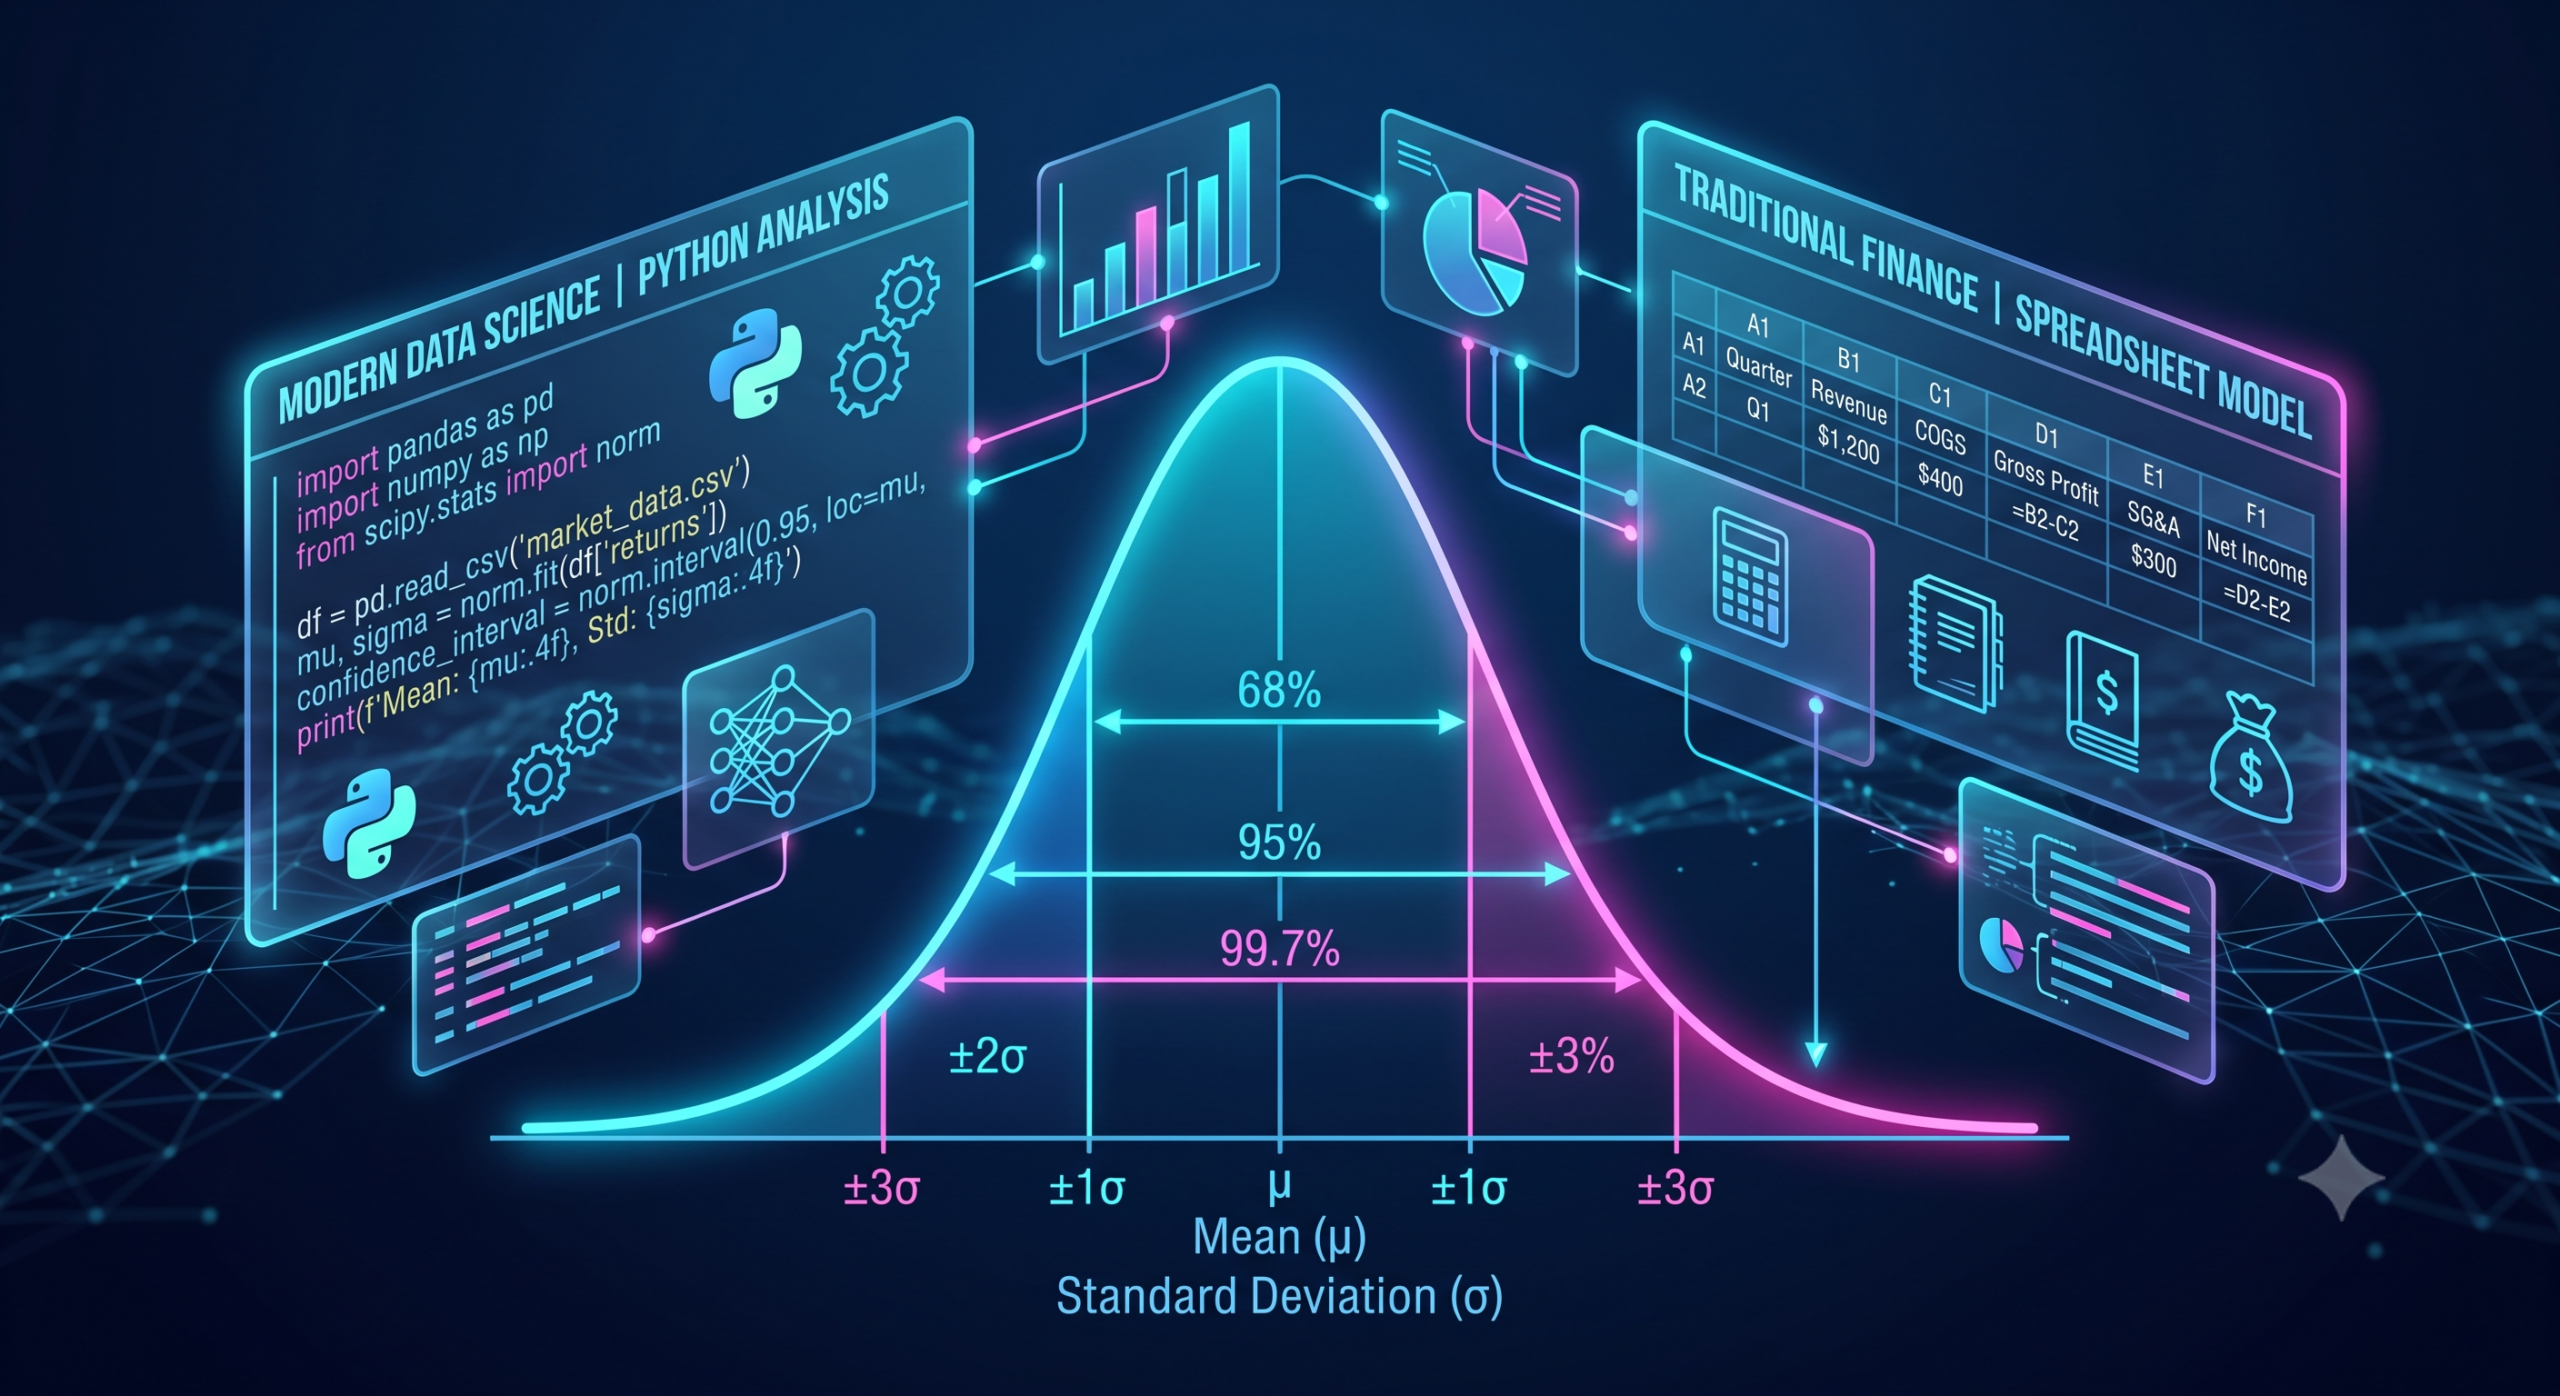
In an era defined by rapid market shifts and complex global supply chains, uncertainty is the only true constant in business. Whether a data team is attempting to forecast quarterly revenue, a project manager is estimating the completion date of a massive infrastructure build, or a financial analyst is assessing portfolio risk, professionals are routinely forced to make critical decisions based on incomplete information.
For decades, organizations relied heavily on deterministic models—a «best guess» or single-point estimation approach. Analysts would input the most likely variables into a spreadsheet and receive a single, definitive outcome. However, this method harbors a fatal flaw: it assumes the world operates on predictable averages. In reality, variables fluctuate. Costs overrun, timelines slip, and market conditions shift.
To combat this, the modern landscape of tech and data analytics has embraced probabilistic modeling, with the Monte Carlo Simulation standing as its most powerful tool. By acknowledging variability and modeling thousands of potential outcomes, this mathematical technique transforms raw uncertainty into actionable, statistical insights. This guide explores the mechanics, applications, and best practices of Monte Carlo Simulations, providing a blueprint for integrating advanced risk forecasting into your analytical toolkit.
The Origins of Probability: A Brief History
The concept of the Monte Carlo Simulation was not born in a modern tech hub, but rather during one of the most highly classified scientific endeavors in history: the Manhattan Project in the 1940s. Mathematicians Stanislaw Ulam and John von Neumann were attempting to predict the behavior of neutrons. Traditional mathematical equations were too rigid to solve the problem due to the immense number of unpredictable variables involved.
Ulam, inspired by his time playing solitaire while recovering from an illness, realized that while calculating the exact mathematical probability of a specific card sequence was nearly impossible, playing hundreds of hands and recording the outcomes would yield a highly accurate statistical approximation. He and von Neumann applied this logic to their physics problem, using early computers to run thousands of random simulations. Because the work was secret, the project required a code name. They chose «Monte Carlo,» a nod to the famous casino town in Monaco known for its games of chance, roulette wheels, and the inherent randomness of probability.
Deterministic vs. Probabilistic Modeling: The Shift in Analytics
To understand why Monte Carlo simulations are so heavily utilized in today’s financial planning and analysis (FP&A) software, we must first understand the difference between deterministic and probabilistic forecasting.
A deterministic model relies on fixed inputs. If an analyst wants to calculate the profit of a new product line, they might assume a fixed manufacturing cost of $10 per unit, a fixed sales price of $20, and a fixed volume of 50,000 units. The formula yields a single, definitive profit figure. While mathematically correct, it is practically fragile. What if raw material costs rise? What if a competitor launches a similar product, forcing a price drop?
A probabilistic model, specifically the Monte Carlo method, replaces these fixed inputs with ranges of possibilities. Instead of stating that manufacturing will cost exactly $10, the model states that the cost will most likely be $10, but could be as low as $8 or as high as $15, following a specific bell curve. By calculating the formula using random values from these ranges thousands of times, the analyst doesn’t get a single profit figure. Instead, they receive a spectrum of possible outcomes and the precise probability of achieving each one.
The Engine Under the Hood: How Monte Carlo Works
While the backend mathematics can be complex, the foundational workflow of a Monte Carlo analysis relies on a structured, logical sequence of steps.
1. Establish the Mathematical Model Every simulation begins with a base equation that connects the input variables to the desired output. This can range from a basic business formula (Revenue – Expenses = Profit) to highly complex algorithms used in algorithmic trading or aerodynamic engineering.
2. Define the Input Variables and Distributions This is the most critical step. The analyst must identify which variables are uncertain and assign a «probability distribution» to them. A probability distribution is a mathematical function that provides the probabilities of occurrence of different possible outcomes. Common distributions include:
- Normal Distribution (The Bell Curve): Used when values are symmetric and cluster around a mean, such as historical inflation rates or average employee attrition.
- Uniform Distribution: Used when every value in a range has an equal chance of occurring, much like rolling a standard die.
- Triangular Distribution: Often used in project management, this relies on three distinct points: an optimistic estimate, a pessimistic estimate, and a most likely estimate.
- Lognormal Distribution: Used for variables that cannot drop below zero but have theoretically unlimited upside, making it highly relevant for modeling stock prices or real estate values.
3. Generate a Sample Dataset Once the boundaries and shapes of the variables are set, a Random Number Generator (RNG) selects a random value for each uncertain variable based on its assigned distribution.
4. Run the Iterations The computer feeds these randomly selected variables into the mathematical model and records the outcome. This process (an iteration) is repeated rapidly. While early scientists ran a few hundred iterations, modern cloud computing and Python scripts easily run 10,000 to 100,000 iterations in a matter of seconds.
5. Analyze the Output The final result is not a single number, but a massive dataset of possible outcomes. This data is typically visualized as a histogram or a cumulative probability curve. Decision-makers can look at the chart and confidently state metrics such as, «Based on our model, there is an 85% probability that our project will finish under budget, but a 5% tail-risk that it exceeds our absolute maximum threshold.»
Deep Dive: Practical Applications Across Industries
The versatility of Monte Carlo Simulation allows it to transcend specific niches, finding utility wherever uncertainty exists.
Financial Modeling and Corporate Finance In finance, Monte Carlo is the gold standard for stress-testing portfolios and assessing Value at Risk (VaR). Analysts use it to model the potential future prices of assets by simulating thousands of different market trajectories based on historical volatility and drift. Furthermore, it is instrumental in Capital Budgeting. When a corporation is deciding whether to invest hundreds of millions into a new factory, Monte Carlo simulations model the long-term impacts of fluctuating interest rates, currency exchange rates, and geopolitical supply chain shocks. (Note: While these simulations provide rigorous statistical frameworks for risk assessment, they are mathematical tools, not crystal balls. They do not constitute direct investment advice nor guarantee future market performance, as real-world markets frequently experience unprecedented «Black Swan» events).
Project Management and Engineering Large-scale projects are notorious for time and budget overruns. Project Management Offices (PMOs) use Monte Carlo analysis to evaluate schedule risks. By simulating the duration of hundreds of interdependent tasks, managers can identify the «critical path» and determine the statistical likelihood of meeting a specific launch date. In engineering, it is used for tolerance analysis—simulating the microscopic variations in manufactured parts to ensure that when assembled, the final product functions safely and reliably.
Supply Chain and Logistics Global logistics networks are highly sensitive to disruption. Supply chain analysts utilize Monte Carlo methods to model demand forecasting and inventory management. By simulating variations in lead times from overseas suppliers alongside fluctuations in consumer demand, companies can optimize their safety stock levels—holding just enough inventory to prevent stockouts without tying up excess capital in warehouses.
Monte Carlo vs. Machine Learning: Bridging the Gap
As Artificial Intelligence dominates the tech conversation, a common question arises: Does Machine Learning (ML) replace the need for Monte Carlo simulations?
The short answer is no; they serve entirely different, yet highly complementary, purposes. Machine Learning excels at pattern recognition. It ingests massive amounts of historical data to find hidden correlations and predict future behavior based on past trends. However, ML models often struggle when faced with unprecedented scenarios where historical data does not exist.
A Monte Carlo simulation, conversely, does not rely strictly on past data to find patterns. It uses a known mathematical model and simulates forward-looking probabilities based on defined parameters. In modern data analytics architectures, the two are frequently paired. Machine Learning algorithms are used to analyze raw data and accurately define the exact shape of the probability distributions (the inputs). Those highly accurate inputs are then fed into a Monte Carlo engine to simulate the future outcomes.
Best Practices for Implementing Simulations
While the technology is highly accessible, executing a valuable Monte Carlo analysis requires rigorous methodology. A poorly designed simulation can provide a false sense of security, often referred to as the «illusion of precision.»
- Scrub Your Data: The adage «Garbage In, Garbage Out» is magnified in probabilistic modeling. Ensure that historical data used to define your distributions is free from extreme, non-repeating outliers that could skew the baseline.
- Account for Correlation: This is the most common error in amateur modeling. If you are simulating a business environment, you cannot treat all variables independently. For example, if raw material costs spike, consumer demand might drop due to subsequent price hikes. If your model does not digitally link these variables (correlation), the simulation will generate impossible scenarios.
- Run Sufficient Iterations: While 1,000 iterations might seem like a large number, complex models require much more to stabilize the output. Aim for a minimum of 10,000 iterations to ensure a smooth, reliable probability curve.
- Leverage the Right Tools: While basic simulations can be built in spreadsheet software using standard randomization formulas, they become computationally heavy and prone to crashing at scale. For enterprise-level analytics, data scientists rely on Python libraries (such as NumPy and pandas), R, or dedicated Cloud FP&A platforms to handle millions of iterations effortlessly.
Frequently Asked Questions (FAQ)
Do I need advanced coding skills to run a Monte Carlo simulation? Not necessarily. While data scientists heavily utilize languages like Python and R for complex, multi-variable simulations, there are numerous commercially available add-ons for standard spreadsheet software that provide intuitive, visual interfaces for running these models without writing a single line of code.
How accurate are the results of a Monte Carlo analysis? The simulation is a statistical approximation, not a guarantee. Its accuracy is entirely dependent on the quality of the input data and the realism of the mathematical model. It will not predict what will happen, but it is highly accurate in predicting the probability of what could happen, assuming the baseline assumptions are sound.
What is the «Flaw of Averages»? Coined by statistician Sam Savage, the Flaw of Averages states that plans based on average assumptions are usually wrong. For instance, if a river has an average depth of 3 feet, a statistician who doesn’t account for variability might drown crossing a section that is 10 feet deep. Monte Carlo simulations cure this flaw by exposing the extremes.
We Want to Hear Your Perspective!
Have you ever relied on a single «best guess» estimate for a major project, only to have unexpected variables completely derail your timeline or budget? Or, has your team recently transitioned to using probabilistic forecasting tools?
Drop a comment below sharing your firsthand experience with navigating uncertainty in your professional field. How does your organization handle risk assessment today? We’d love to feature the best insights in our upcoming community newsletter!